Infrastructure
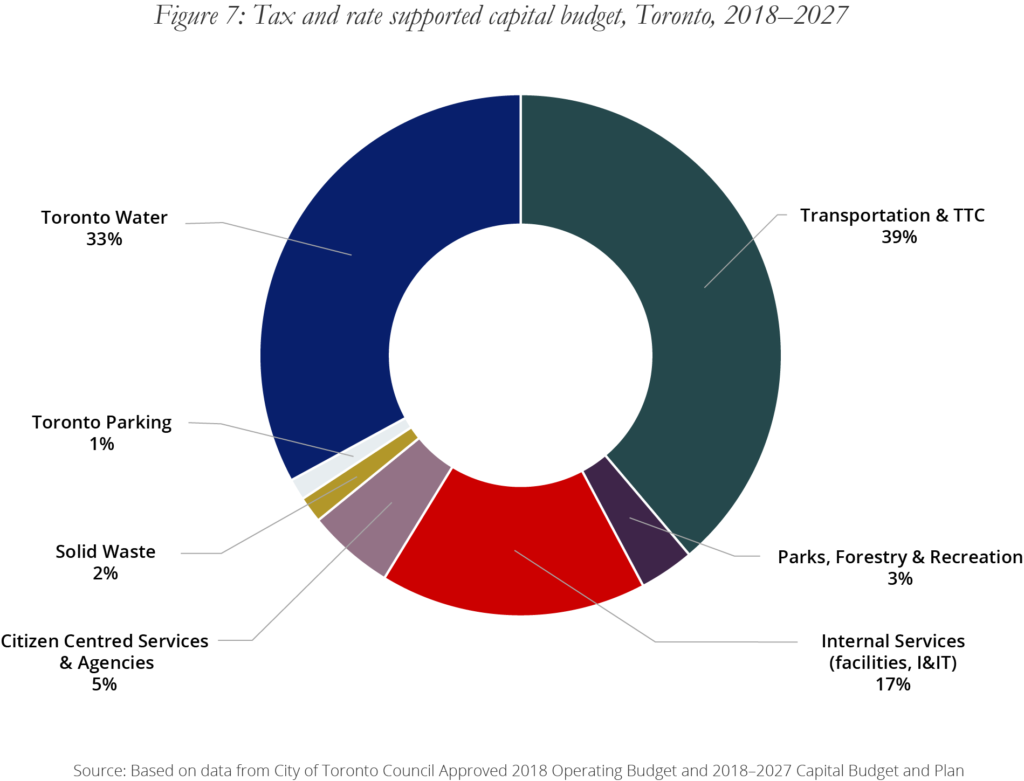
Tax and rate supported capital budget, Toronto, 2018-2027
Almost 40 percent of the capital budget is dedicated to transportation and the TTC (Figure 8). More than one third of capital funding is directed to rate-based services including water treatment and pipes to supply it, wastewater collection and treatment, stormwater management, and solid waste. The remainder of the capital budget consists of investment in City buildings, vehicles, and information technology; parks and recreation; police stations and vehicles; libraries; and long-term care facilities.

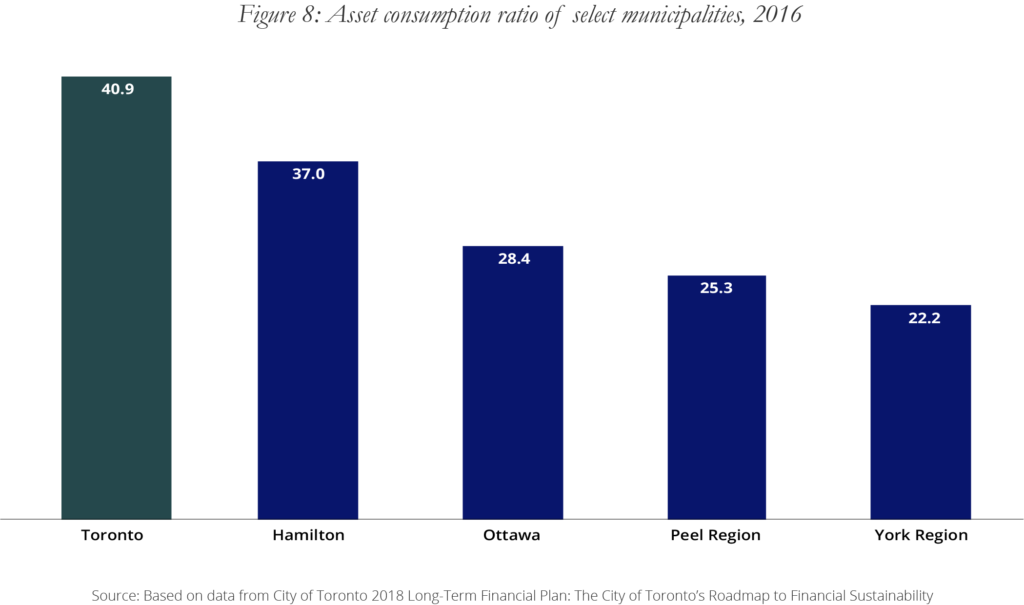
Asset consumption ratio of selected municipalities
One way to measure the state of the City’s infrastructure is to look at how much of its depreciable assets have been used up (and therefore are in need of repair or replacement), compared to the original cost of those assets. That comparison is known as the asset consumption ratio (Figure 9). If a government has been maintaining its assets, its asset consumption ratio will be relatively low.
Toronto’s asset consumption ratio is relatively high compared to other Ontario municipalities. The higher ratio can be explained, in part, by differences in the rate of growth and maturity of the City compared to the other municipalities. Although Toronto is growing, its existing assets were largely built to support the population growth in the 1950s and 1960s. It is still true that the City cannot maintain the infrastructure it has or invest in new infrastructure without new revenues.

