Taxes and Revenues
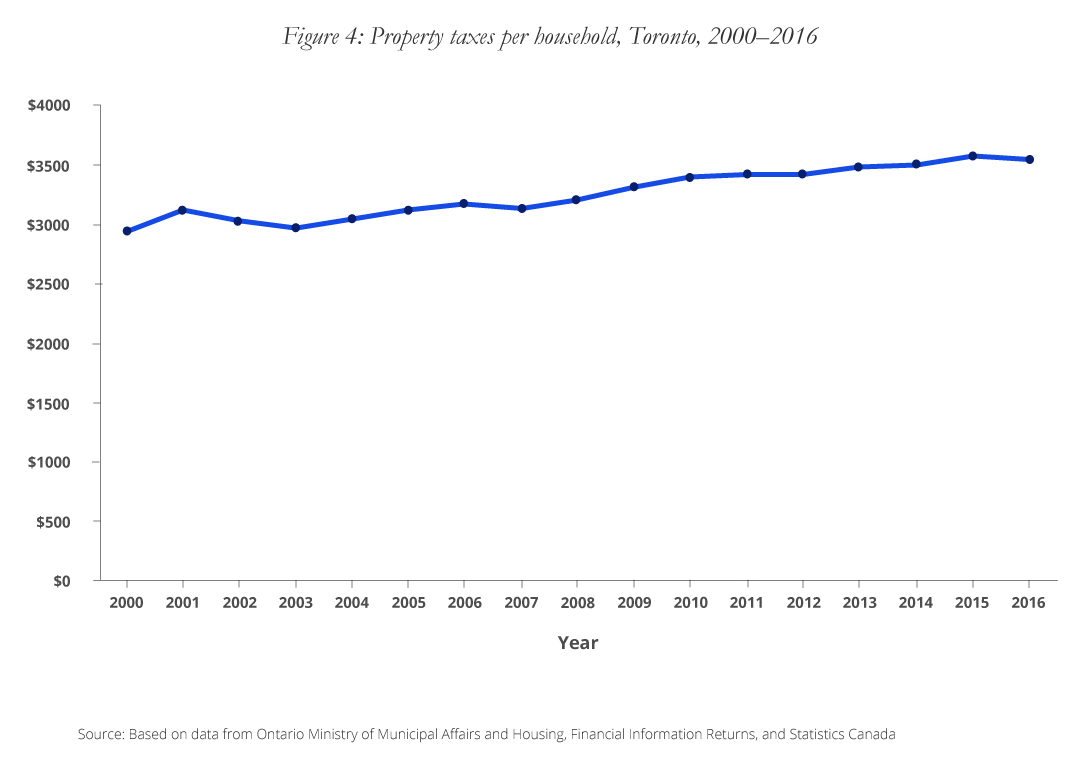
Property taxes per household, Toronto, 2000-2016
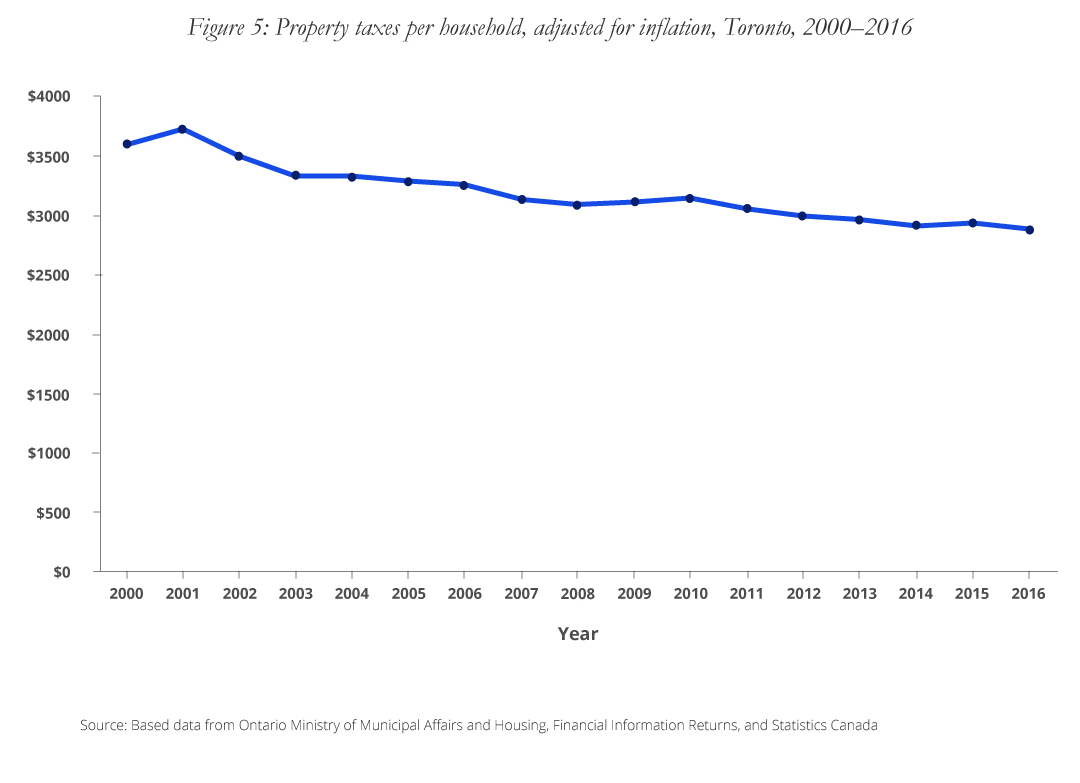
Property taxes continue to grow slowly (Figure 4). Although, over the last 15 years, property taxes have been increasing steadily, when adjusted for inflation, property taxes per household actually declined from 2000 to 2016 (Figure 5). In other words, property taxes per household have been increasing at less than the rate of inflation since 2000 (Figure 6).


Select revenues per household, adjusted for inflation, Toronto, 2001-2016
The City relies on a number of revenue sources to pay for programs and services (Figure 7). The largest is the property tax followed by provincial and federal transfers and user fees and charges. The rest of Toronto’s revenues come from a range of smaller sources, which include the Municipal Land Transfer Tax and rents, licences, and fines.
When adjusted for inflation and population growth, Toronto’s property taxes per household fell between 2001 and 2016. User charges increased over the 15-year period while other revenues from rents, licences, permits, fines, and other sources were relatively flat. From the introduction of the Land Transfer Tax in 2008, its revenues have increased steadily, mirroring the decline in property taxes.
During the same period, federal and provincial transfers increased (transfers include those for operating purposes as well as for tangible capital assets). Provincial transfers increased after 2008 when the provincial share of Ontario Works benefits increased from 80 to 100 percent. After 2008, the City stopped paying the Province for the Ontario Disability Support Program (ODSP) and the Ontario Drug Benefit (ODB) Program. Starting in 2011, federal and provincial transfers for capital purposes declined.

